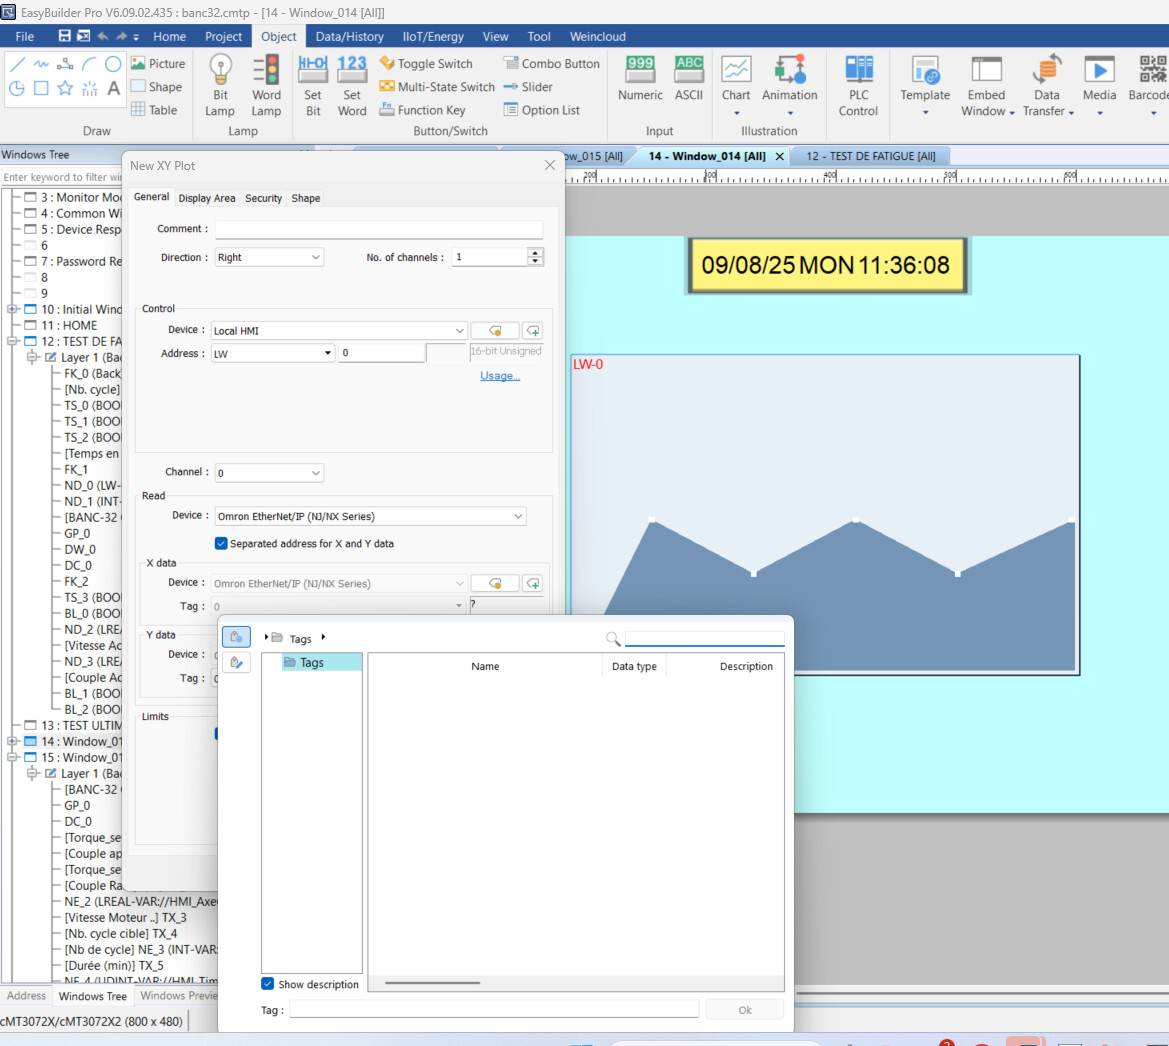
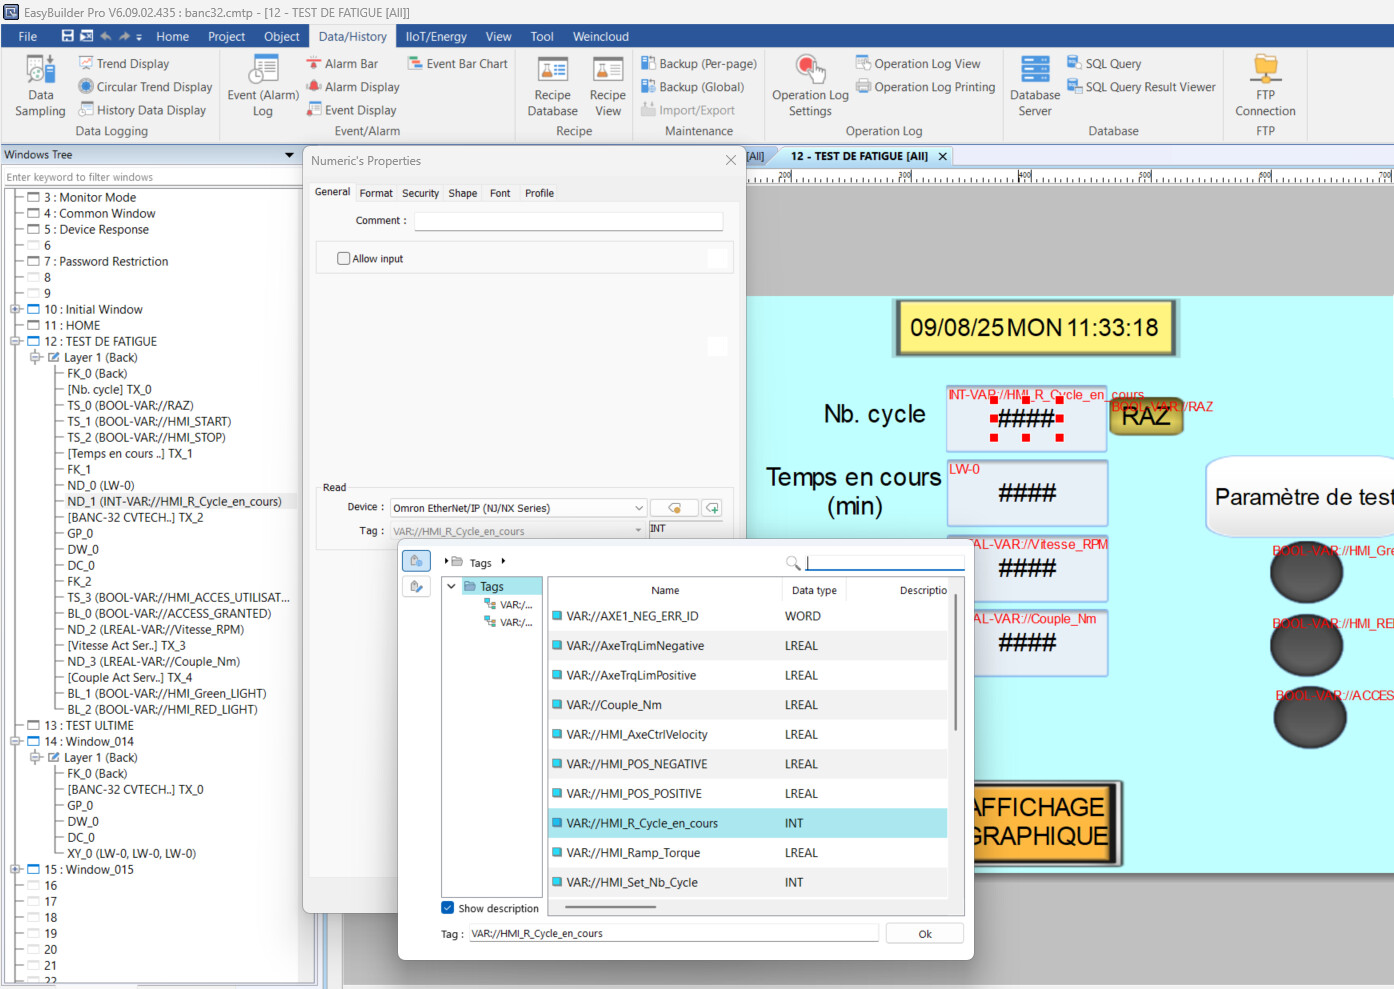
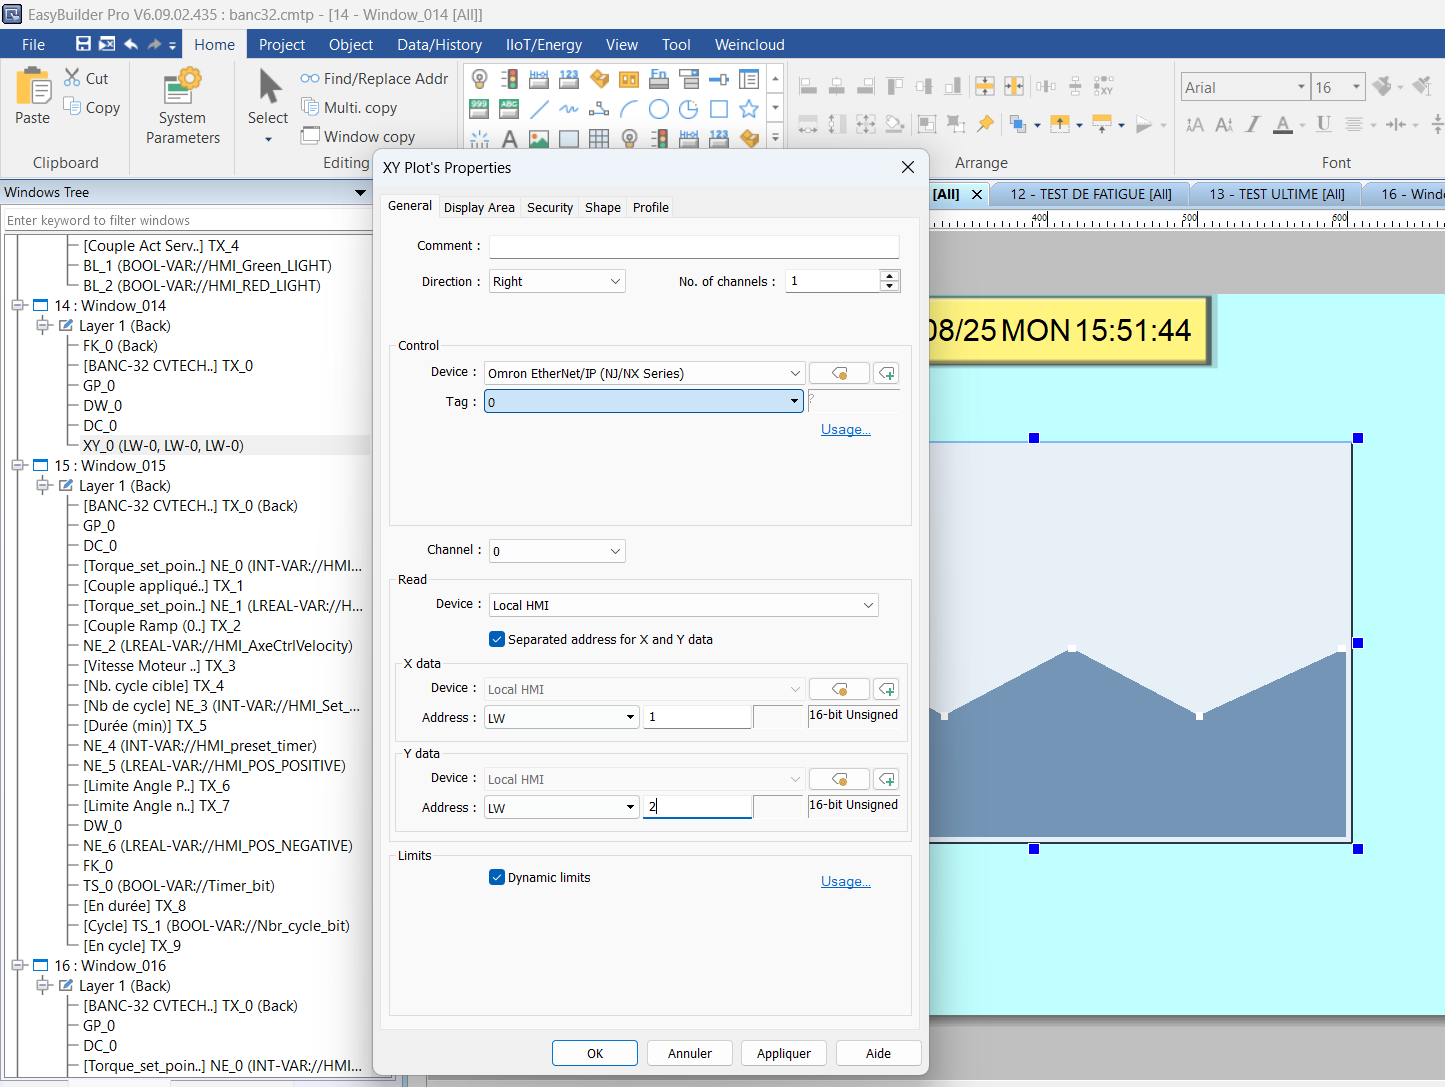
I’m using Weintek hmi with OMRON, i imported all tags and created what in want but something is missing. I would like to acquire the torque in function of the position, i have the variable of position and the torque both are Real data type but when i go under object, chart and select XY Plot, i separated X(position) and Y(Torque). But when i go to select select tag appropriate to the axis, there is no tags .
it’S weird, the tag exist but in xy plot function there is no one, for my buton and numeric display i can see them aldo in bar graph i can see them it’S very weird. any one faced this situation?
Thank you for contributing to our forum.
Could you attach screenshots of what your XY plot setup looks like, along with any other images that might help us further diagnose the issue?
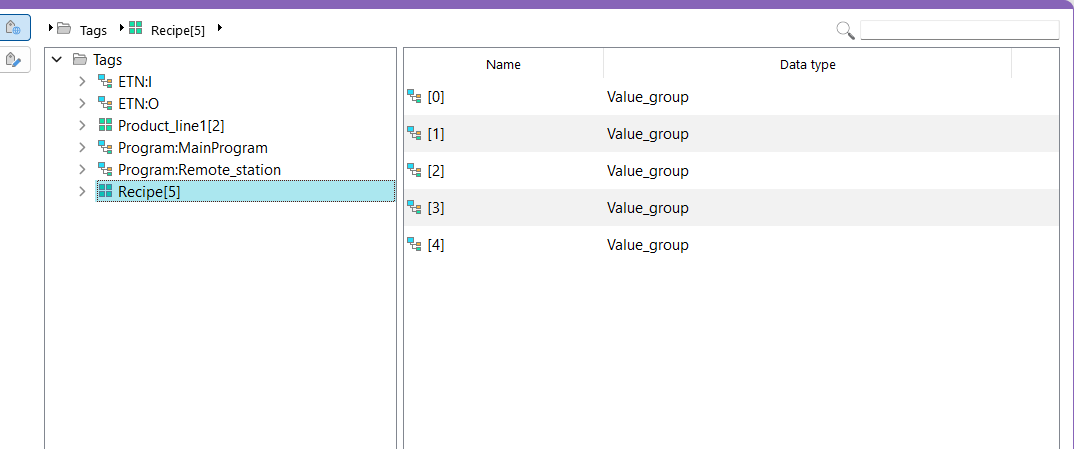
The reason your tags do not show up within the XY plot is because the XY plot object requires that the memory registers be consecutive for the 1st, 2nd, 3rd, and so on for the data points attached. If they are a single memory register, then they will not show up.
Tags that show up are arrays with consecutive memory registers
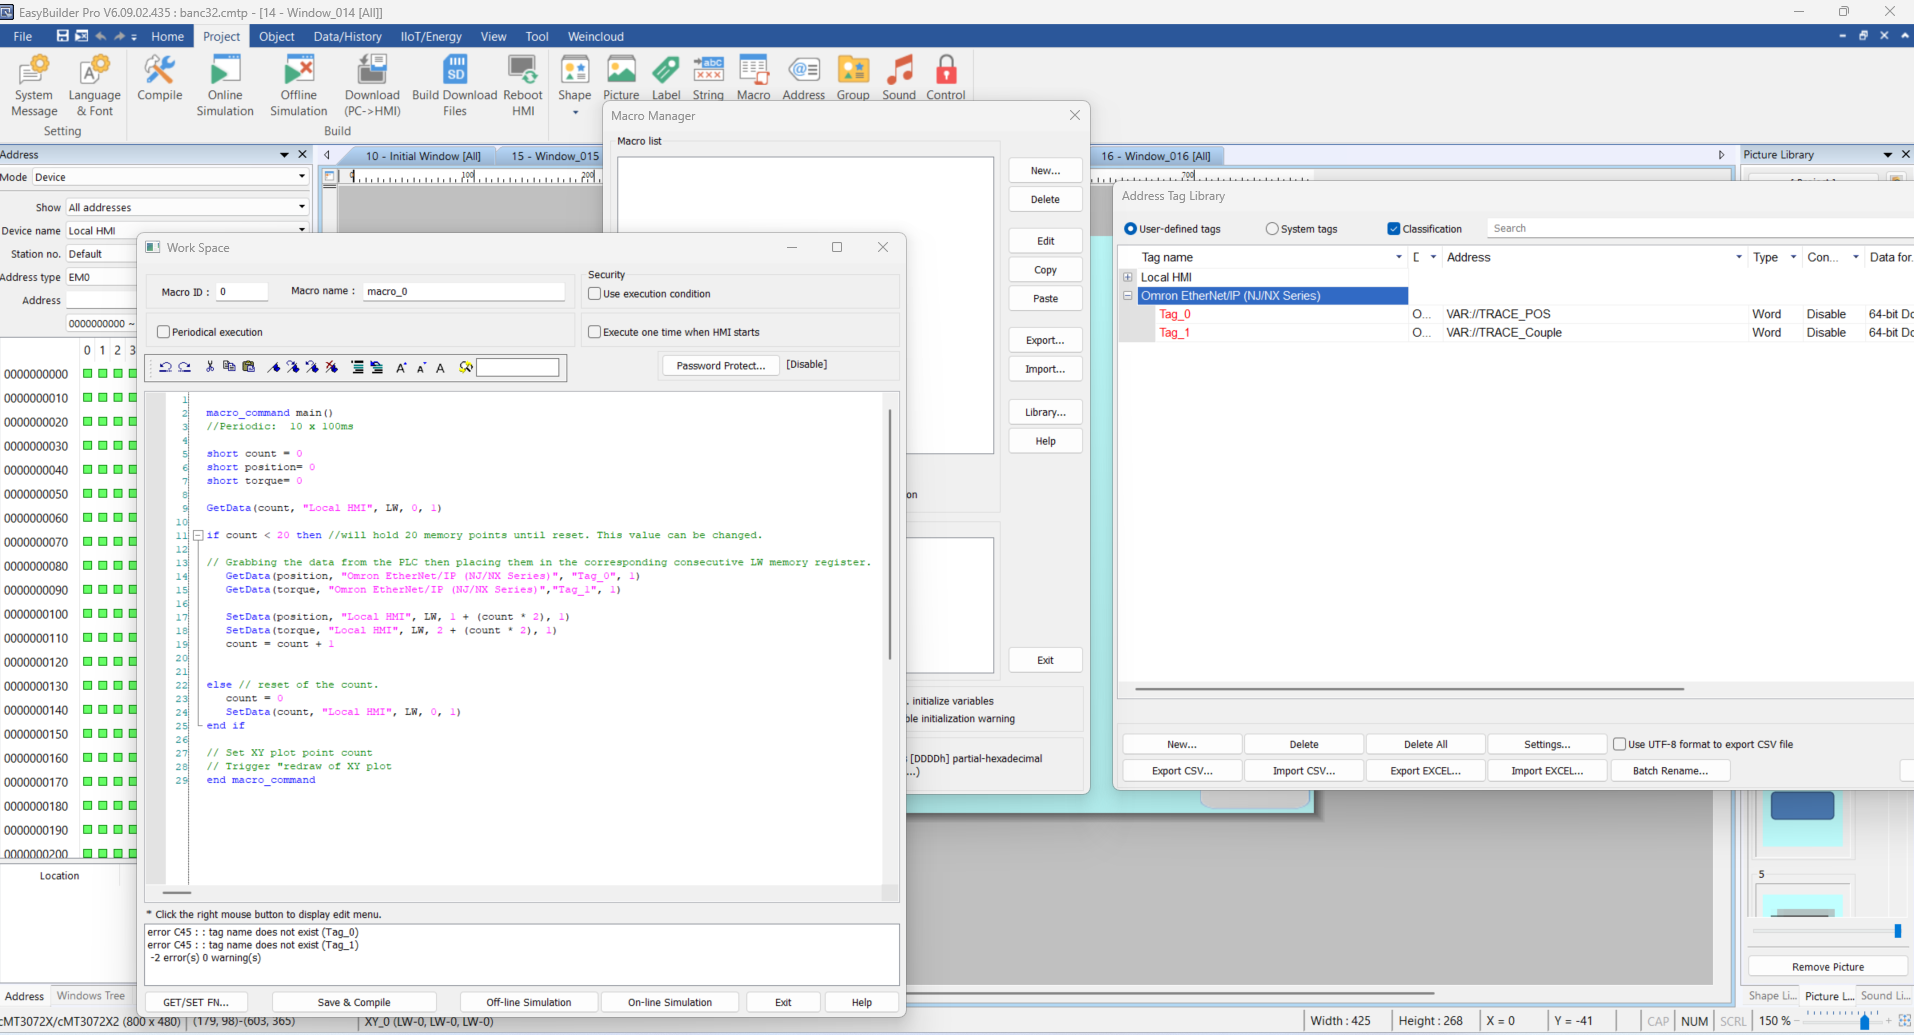
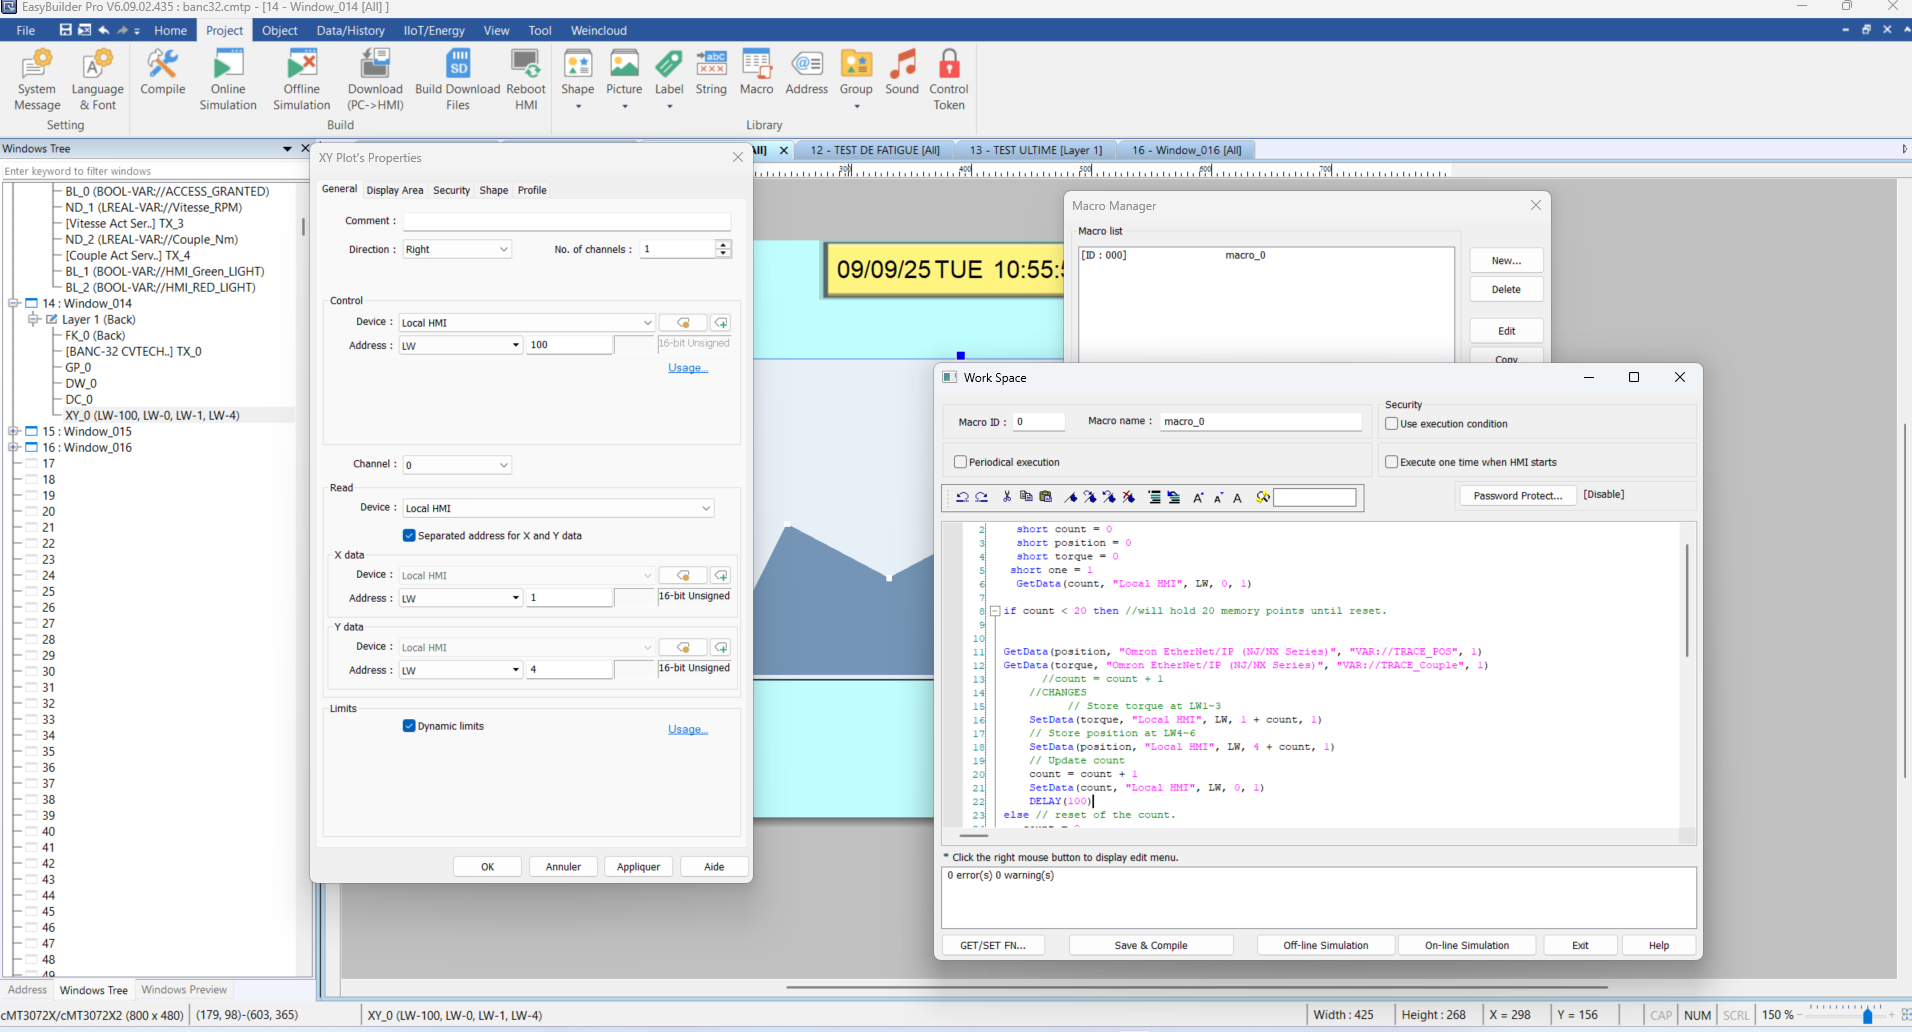
The solution we recommend is a macro that, on a periodical execution, will take the readings from the PLC and manually update consecutive memory registers. Below is an example:
Periodic:  10 x 100ms

short count = 0
short position= 0
short torque= 0

GetData(count, "Local HMI", LW, 0, 1)

if count < 20 //will hold 20 memory points until reset. This value can be changed.

// Grabbing the data from the PLC then placing them in the corresponding consecutive LW memory register.
   GetData(position, "Omron PLC", "Tag", 1)
   GetData(torque, "Omron PLC", "Tag", 1)

   SetData(position, "Local HMI", LW, 1 + (count * 2), 1)
   SetData(torque, "Local HMI", LW, 2 + (count * 2), 1)
   count = count + 1


else // reset of the count.
   count = 0
   SetData(count, "Local HMI", LW, 0, 1)
end if

// Set XY plot point count
// Trigger "redraw of XY plot
ok i think the macro work well, then in setting of XY PLOT should i set the variable on Adress of local HMI not directly from plc, the macro will take it from plc and put it in LW1 and LW2 ? i’m right ?
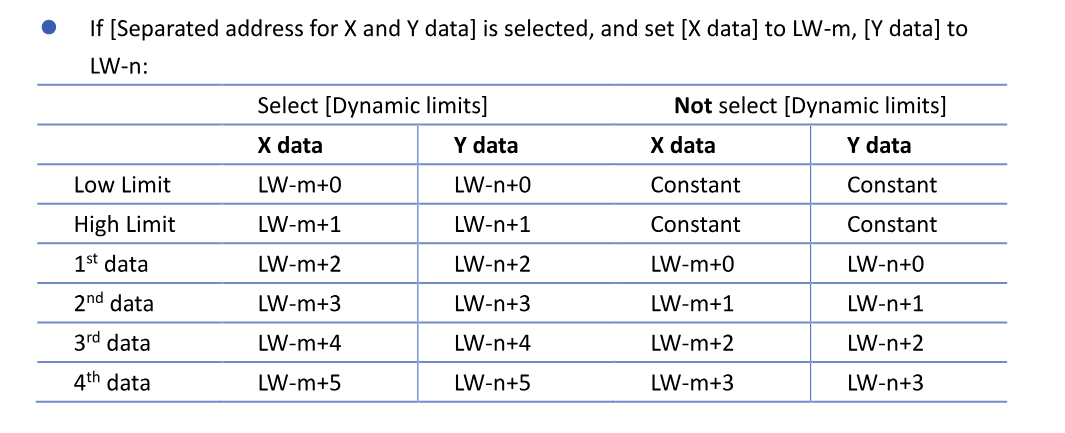
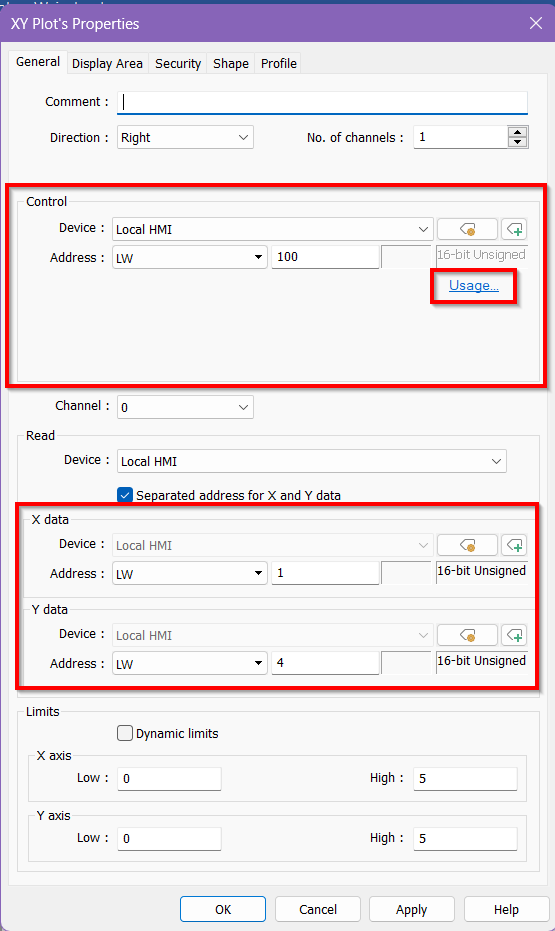
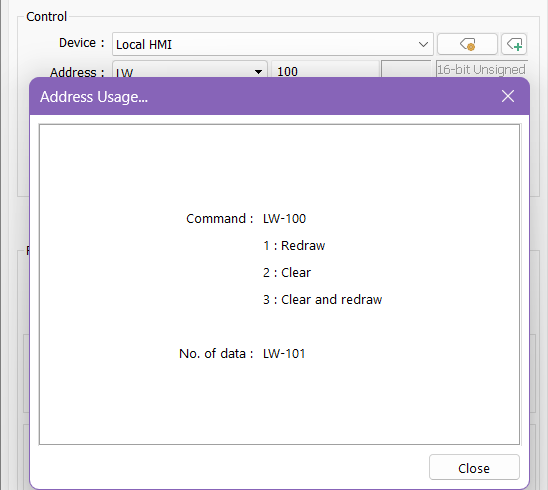
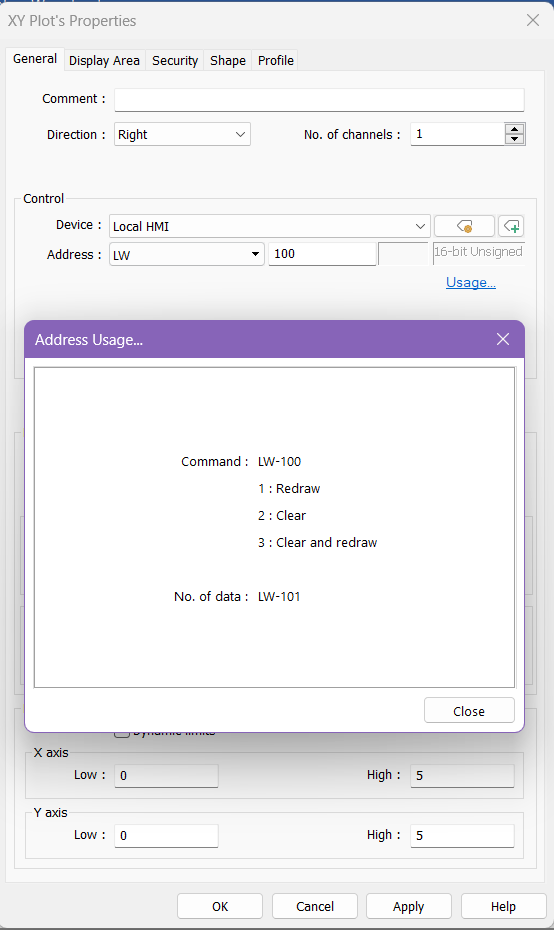
Below, I made a minor change to the macro. We need the values to be consecutive; therefore, the macro now allows the torque values to be placed from LW 1–3 and the position values from LW 4–6. Then, within the XY plot, I set the X data to start at LW 1 and the Y data to start at LW 4. Now, I can use the control address at LW 100 to draw and erase the plot. Note that the sequential address at LW 101 is used to determine how many points to draw on the plot.
Please let me know if you have any other questions.
Do any changes occur after using your LW-100 command to redraw the map? Also, what values are you using for the number of data points to plot on the graph?
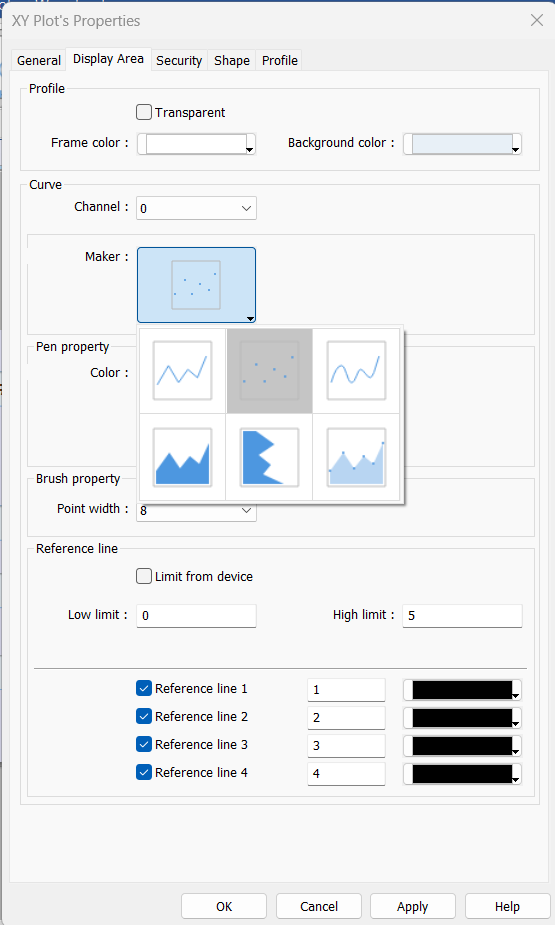
Furthermore, it may be helpful to switch your XY plot to a scatter plot for testing because line graphs require at least two different points to be plotted before they appear on the graph.
Here is also a quick resource on our XY plots that may help:. XY Plot Video