Hi @younesstazi1 ,
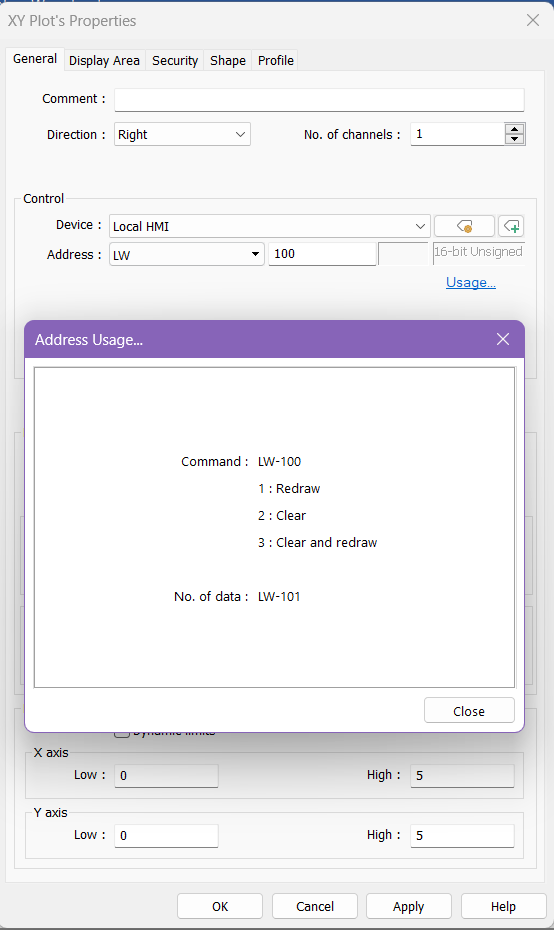
Do any changes occur after using your LW-100 command to redraw the map? Also, what values are you using for the number of data points to plot on the graph?
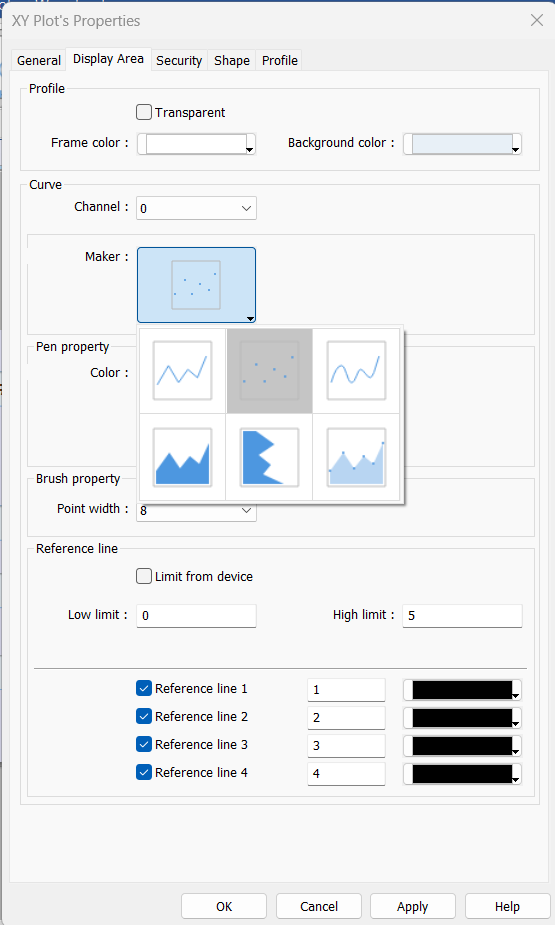
Furthermore, it may be helpful to switch your XY plot to a scatter plot for testing because line graphs require at least two different points to be plotted before they appear on the graph.
Here is also a quick resource on our XY plots that may help:. XY Plot Video
Commands to draw plots on the graph and clear
XY Plot Type