Hi @mmula
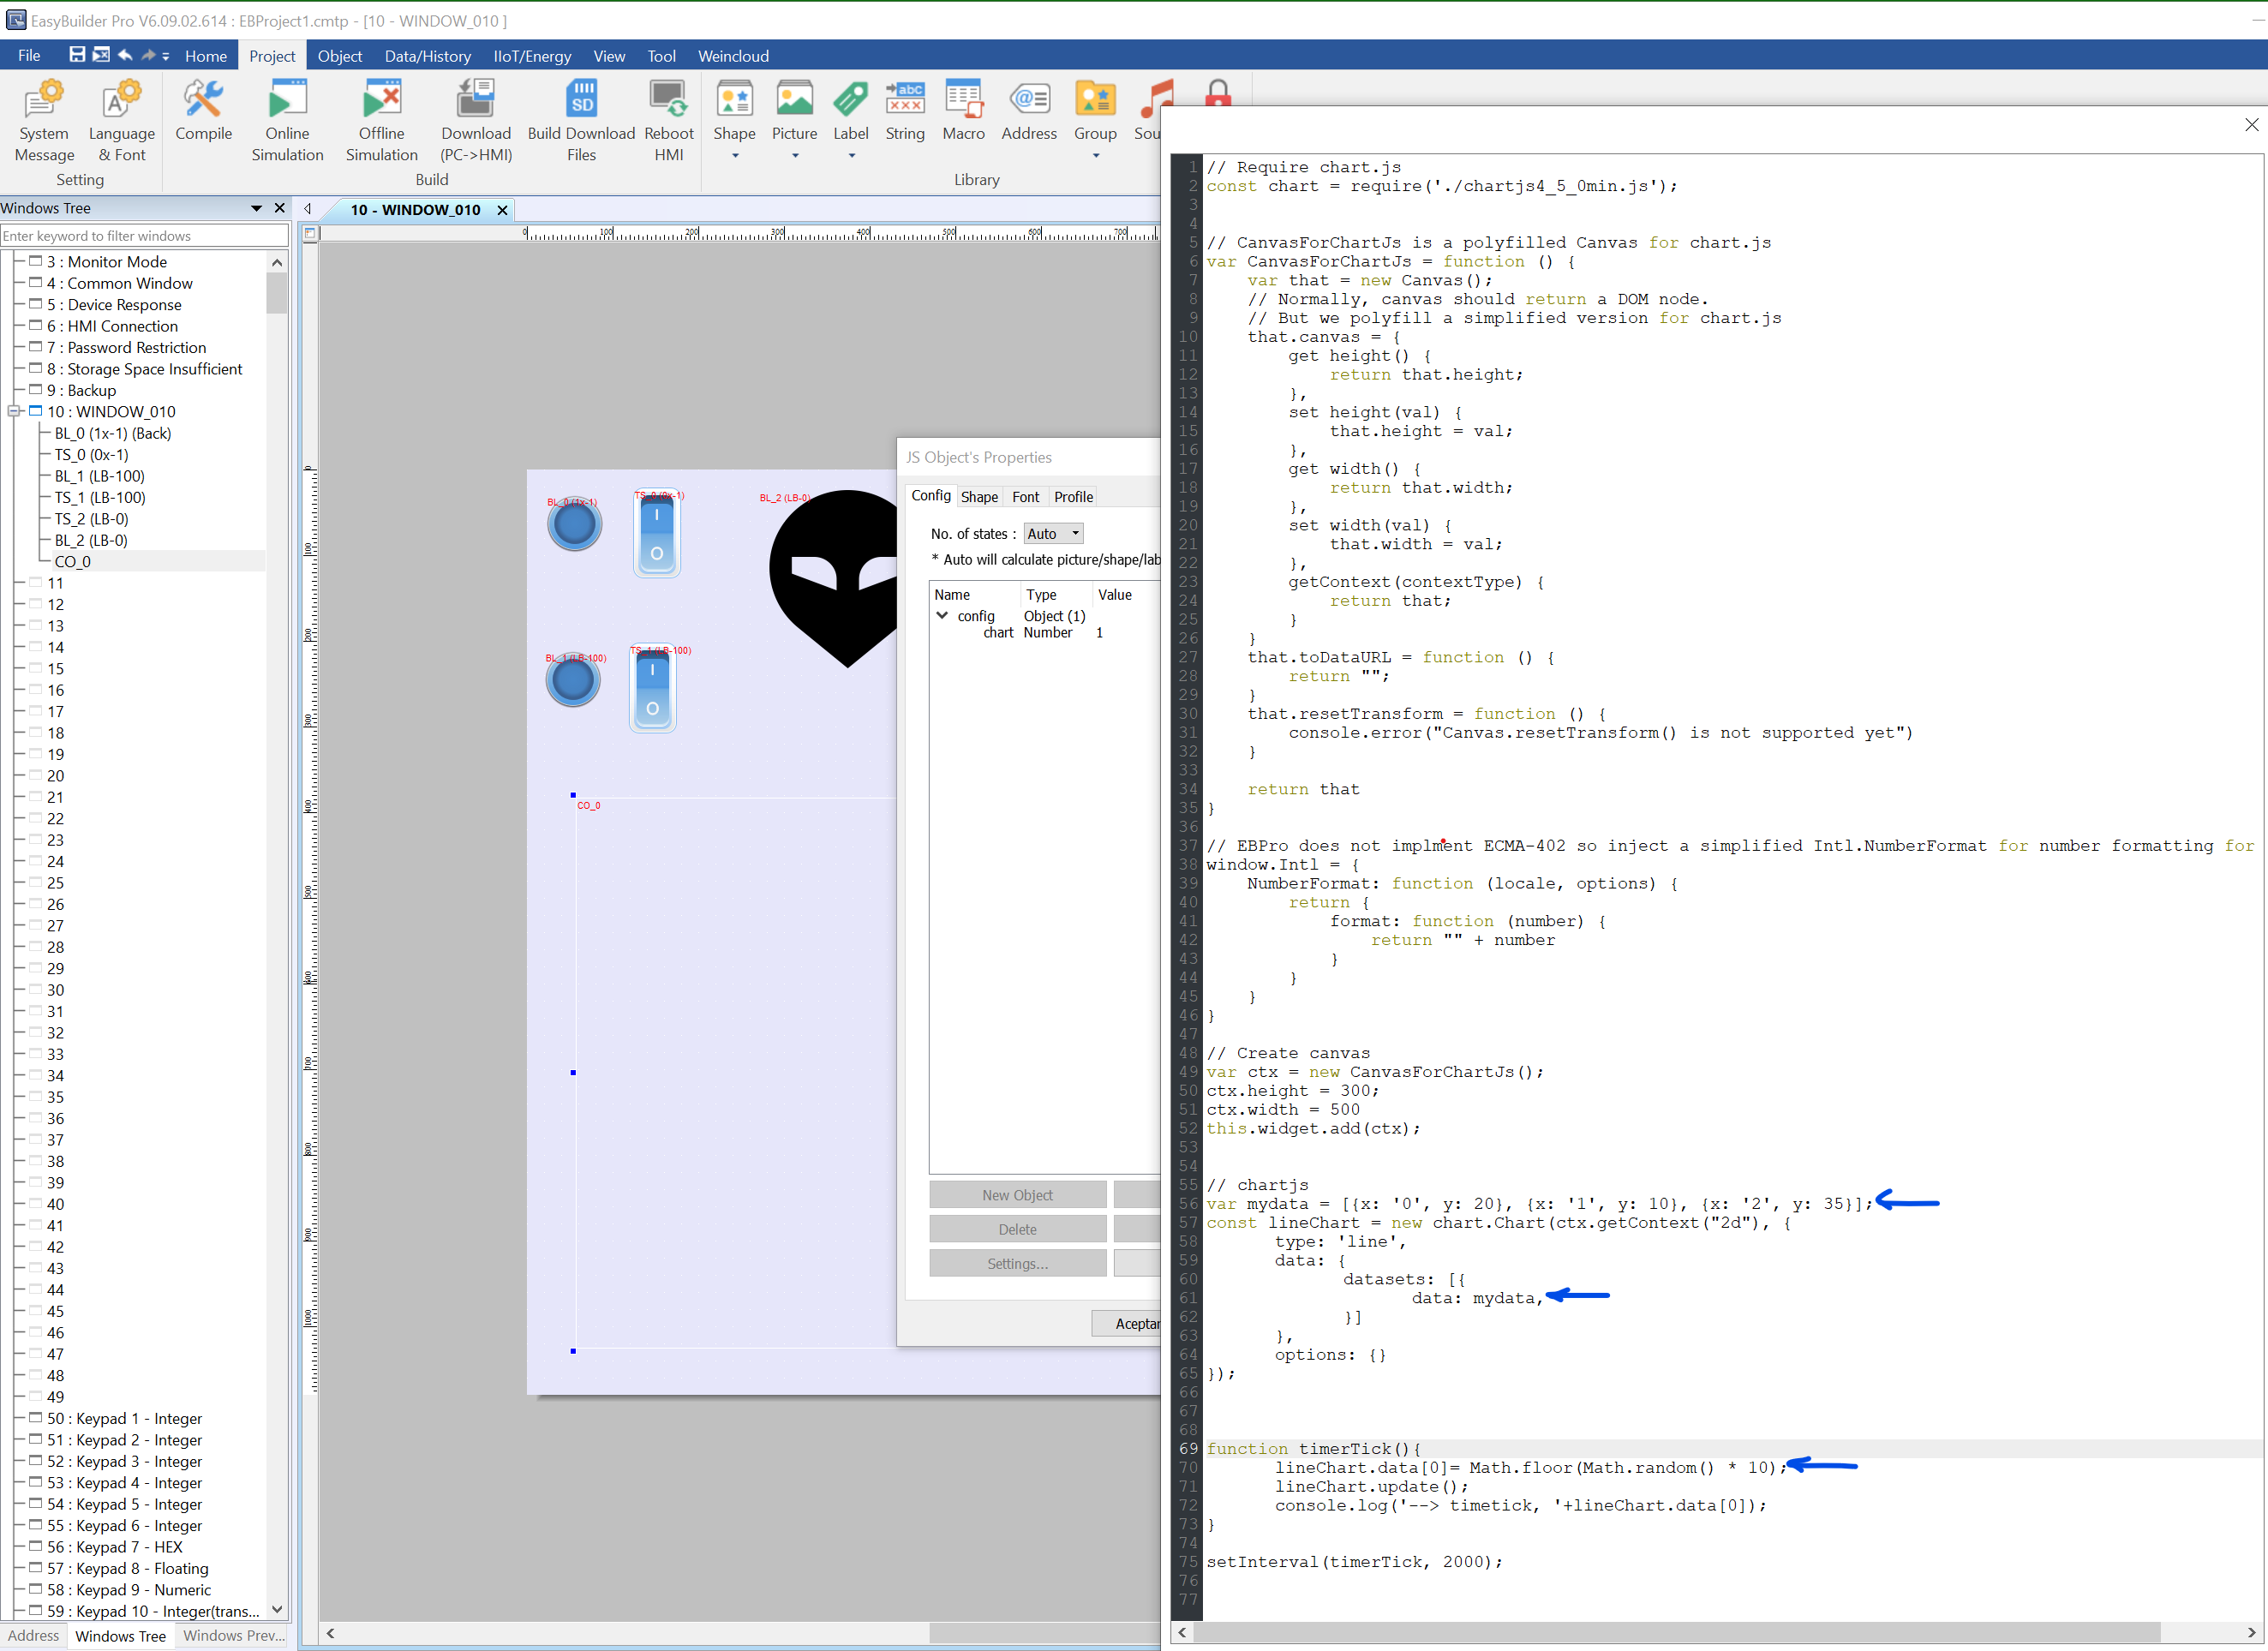
I may have found a way to update the chart as new values are generated. I modified the timerTick function to randomly generate a new Y value, then manually inserted the new X and Y values into the lineChart object using:
lineChart.data.datasets[0].data.push({ x: newX, y: newY });
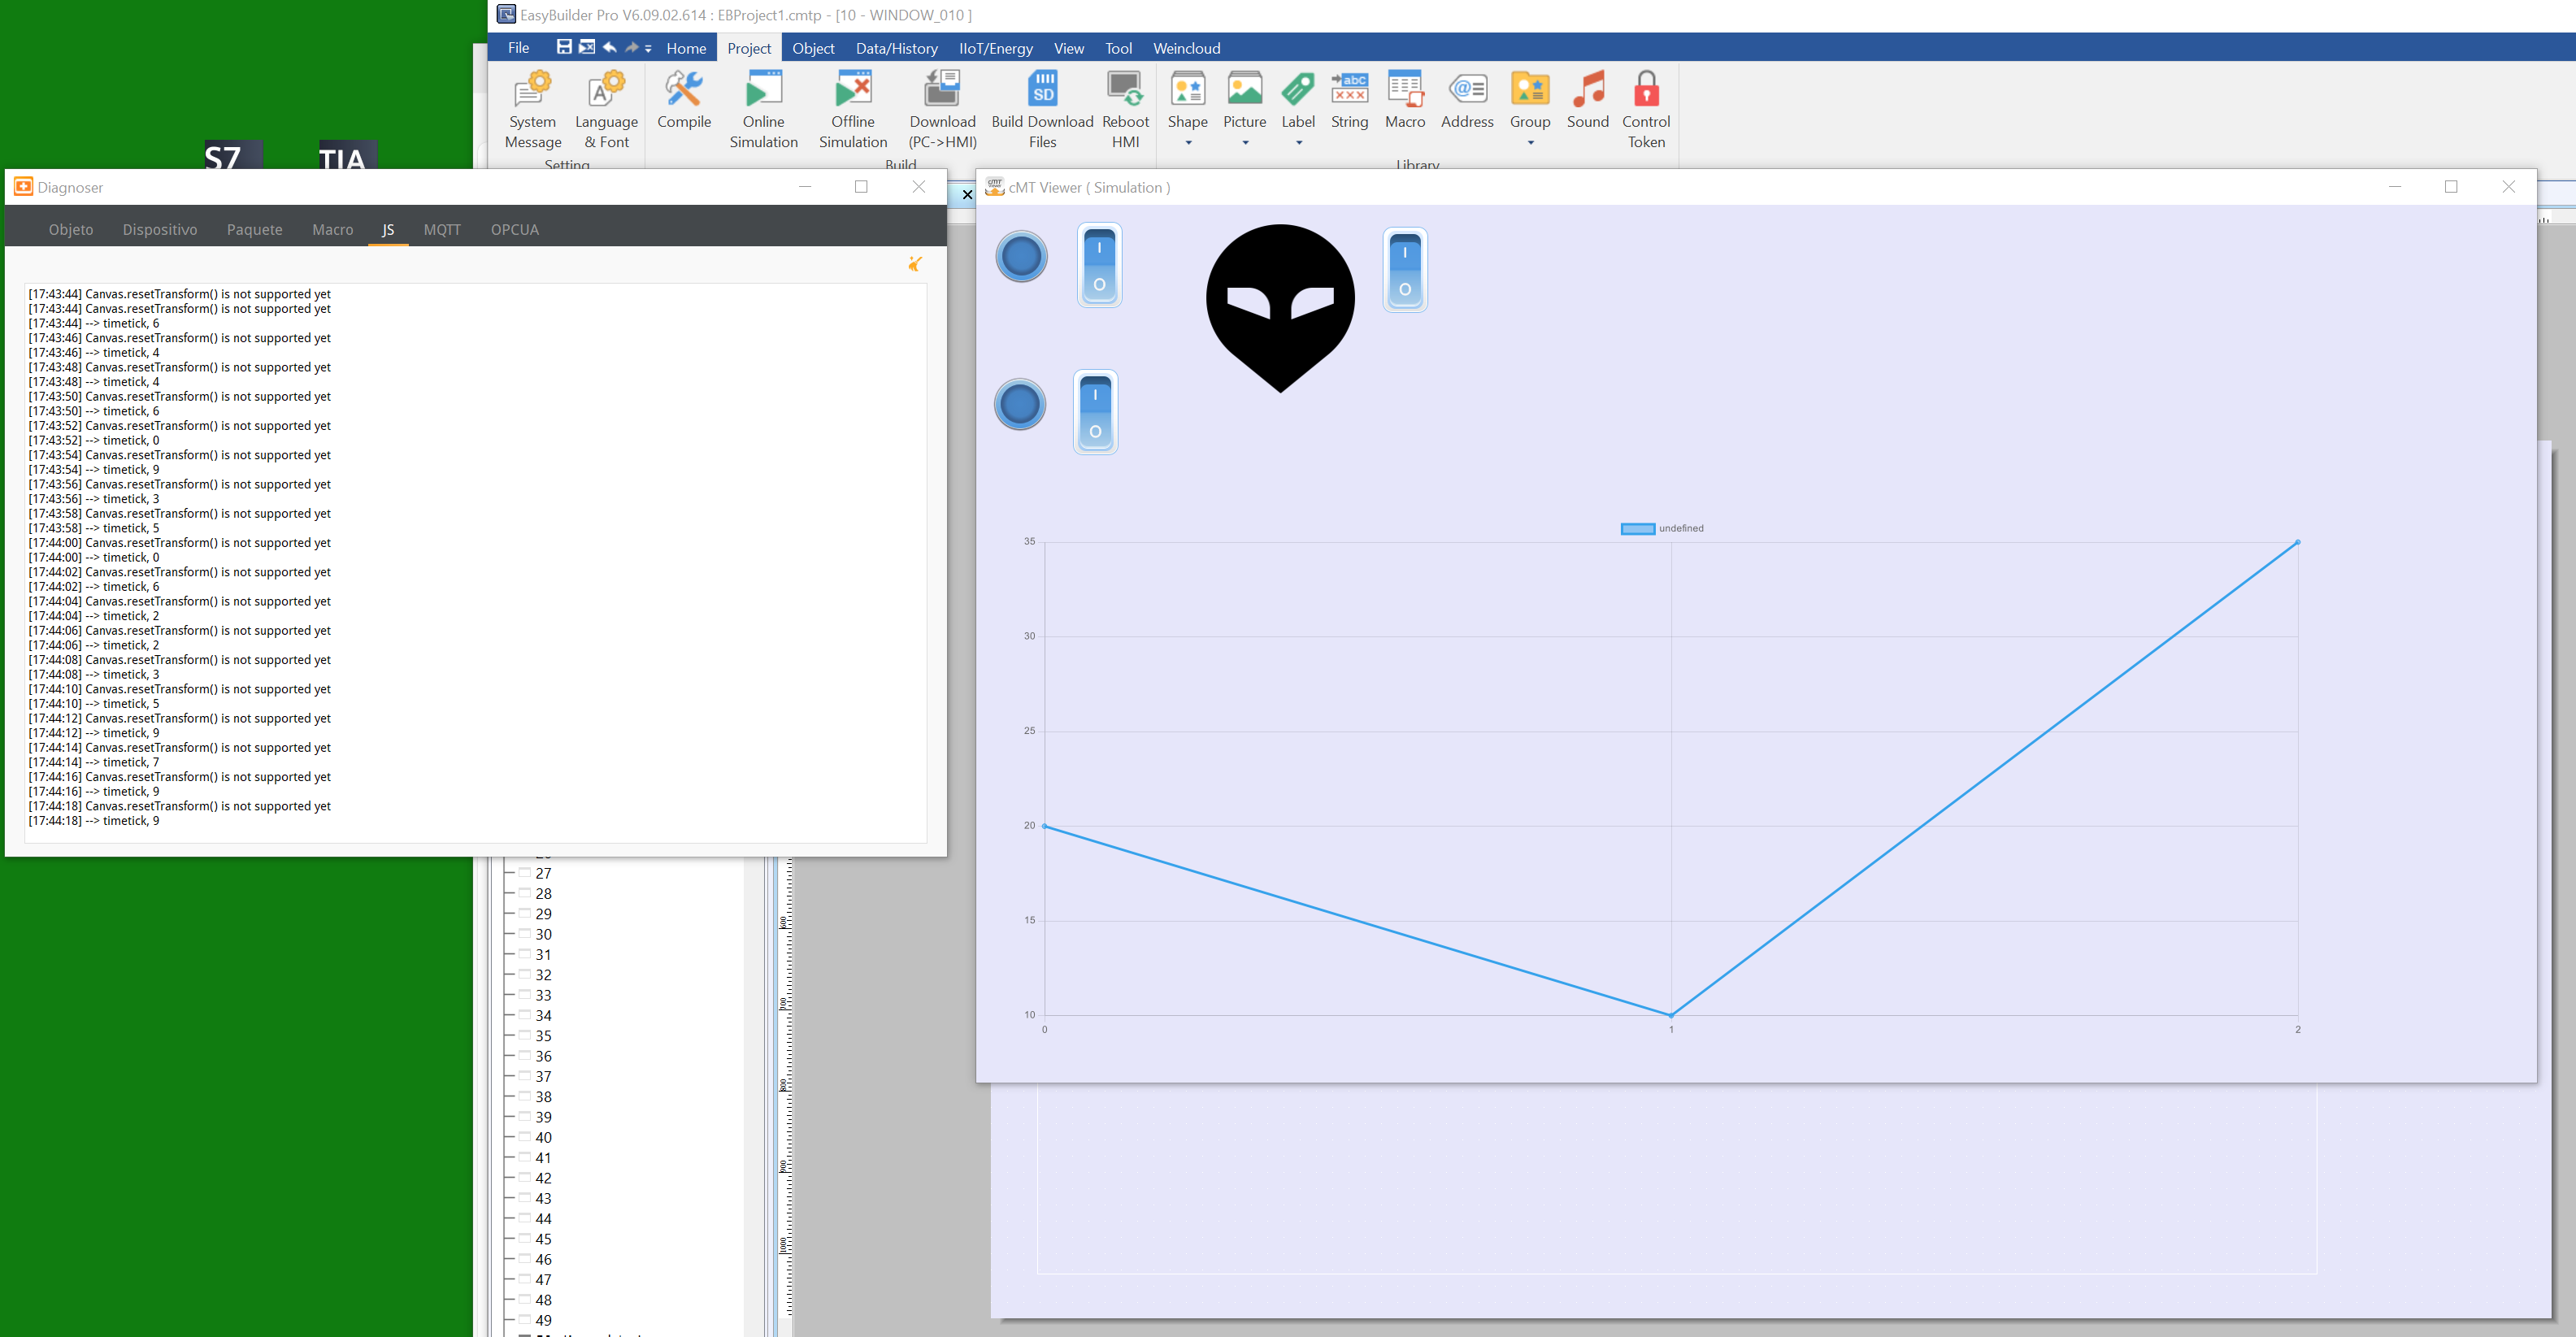
This successfully adds the new data point to the chart and renders it in real time.
A couple of things to note:
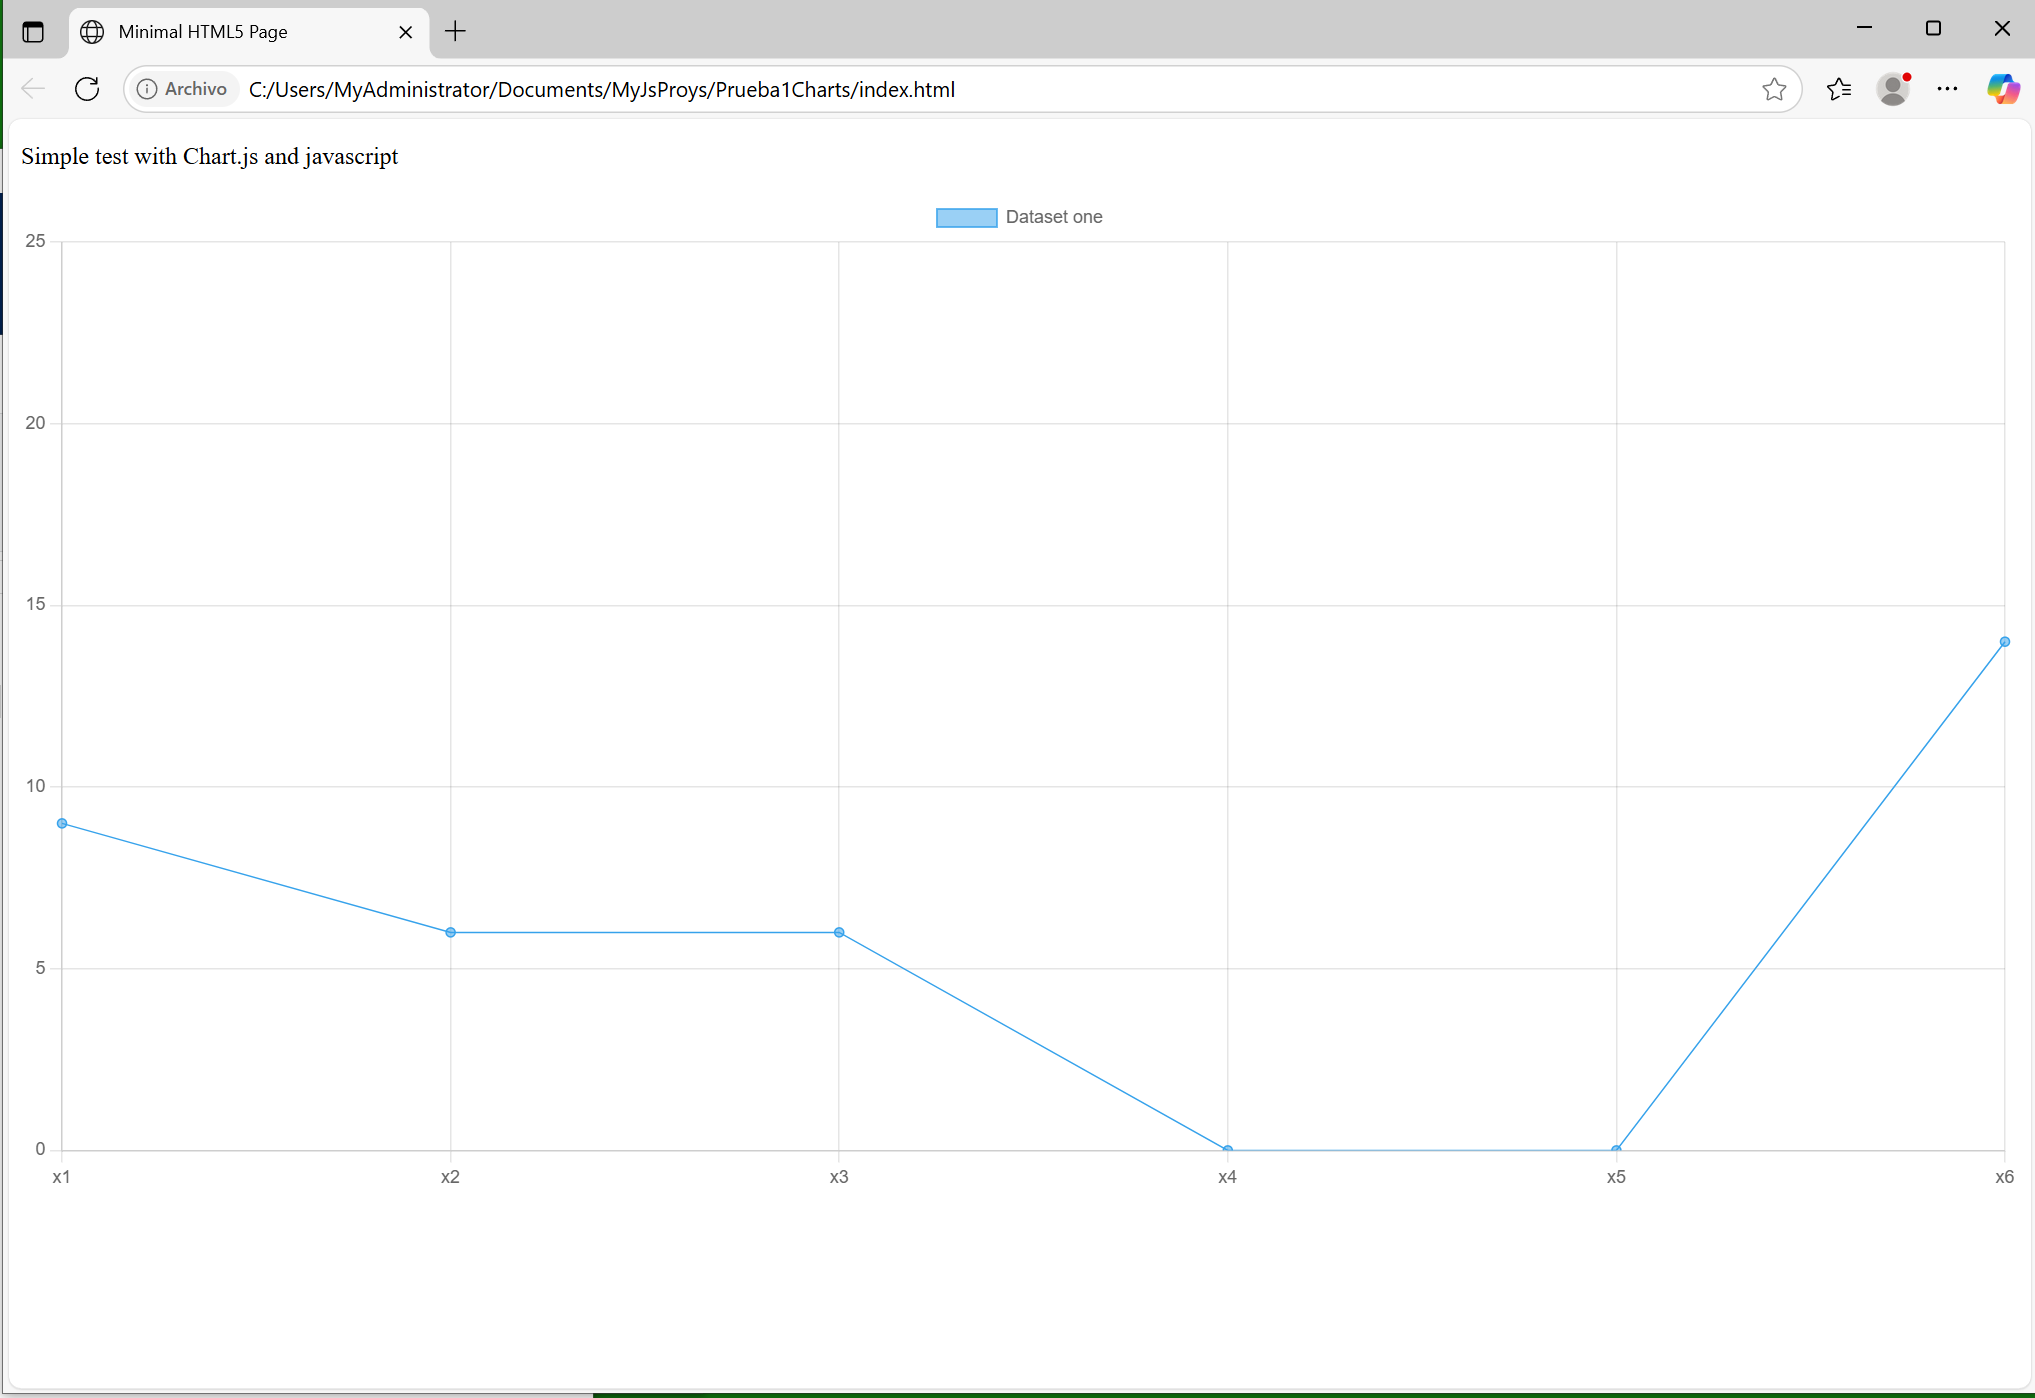
- I used integers for the X values, but string values also work (e.g.,
x: String(timeIndex)).
- I also made some changes to the
options configuration in the full code to adjust scaling and animation. Feel free to modify or remove those settings based on your needs.
- Lastly, while it is possible to use the JavaScript-based line chart, we recommend using the built-in, pre-designed objects like the Trend Display object in EasyBuilder Pro for better performance, compatibility, and ease-of-use.
Please let me know if you have other questions!
FULL FUNCTION UPDATE:
let timeIndex = 3;
function timerTick() {
const newY = Math.floor(Math.random() * 10);
lineChart.data.datasets[0].data.push({ // manual update
x: timeIndex, // same 3 index values
// updated y value
y: newY
});
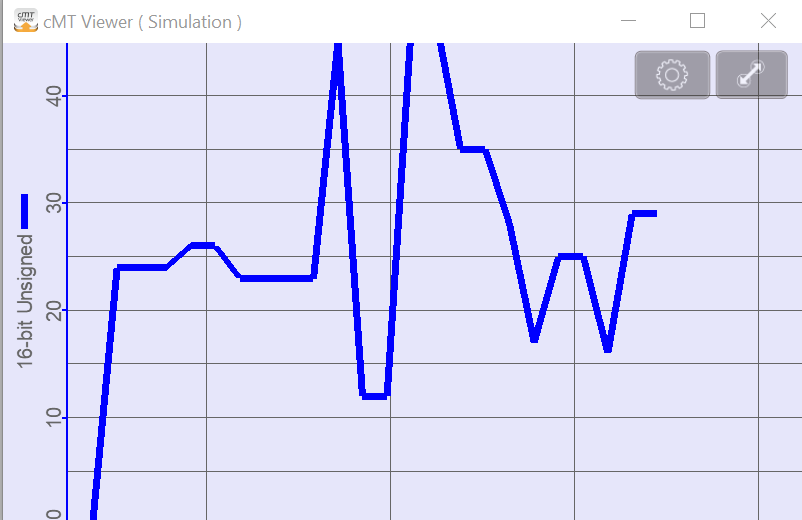
// keep the chart moving along with the most up to date data
if (lineChart.data.datasets[0].data.length > 10) {
lineChart.data.datasets[0].data.shift(); // keep chart clean
}
// redraw the line chart
lineChart.update();
console.log("Tick", timeIndex, "→", newY);
timeIndex++;
}
setInterval(timerTick, 2000);
FULL CODE:
// Require chart.js
const chart = require('./chart.js');
// Add date-fns date adapter for chart.js
require('./chartjs-adapter-date-fns.bundle.min.js');
// utils for demo
const demoUtils = require('./utils.js');


// CanvasForChartJs is a polyfilled Canvas for chart.js
var CanvasForChartJs = function () {
    var that = new Canvas();
    // Normally, canvas should return a DOM node.
    // But we polyfill a simplified version for chart.js
    that.canvas = {
        get height() {
            return that.height;
        },
        set height(val) {
            that.height = val;
        },
        get width() {
            return that.width;
        },
        set width(val) {
            that.width = val;
        },
        getContext(contextType) {
            return that;
        }
    }
    that.toDataURL = function () {
        return "";
    }
    that.resetTransform = function () {
        console.error("Canvas.resetTransform() is not supported yet")
    }
    return that
}

// EBPro does not implment ECMA-402 so inject a simplified Intl.NumberFormat for number formatting for chart.js
window.Intl = {
    NumberFormat: function (locale, options) {
        return {
            format: function (number) {
                return "" + number
            }
        }
    }
}

// Create canvas
var ctx = new CanvasForChartJs();
ctx.height = 300;
ctx.width = 500
this.widget.add(ctx);


// chartjs
var mydata = [{x: '0', y: 20}, {x: '1', y: 10}, {x: '2', y: 35}];
const lineChart = new chart.Chart(ctx.getContext('2d'), {
    type: 'line',
    data: {
        datasets: [{
            data: mydata,
        }]
    },
    options: {
  animation: false,
  parsing: false,
  scales: {
    x: {
      type: 'linear',
      position: 'bottom'
    },
      y: {
              beginAtZero: true      // optional: always start Y-axis from 0
        }
      }
    }
});


//updated code

let timeIndex = 3;
function timerTick() {

    const newY = Math.floor(Math.random() * 10);
    lineChart.data.datasets[0].data.push({ // manual update
        x: timeIndex, // same 3 index values
        // updated y value
        y: newY
    });


    // keep the chart moving along with the most up to date data
    if (lineChart.data.datasets[0].data.length > 10) {
        lineChart.data.datasets[0].data.shift();  // keep chart clean
    }


    // redraw the line chart
    lineChart.update();

    console.log("Tick", timeIndex, "→", newY);
    timeIndex++;
}

setInterval(timerTick, 2000);