- HMI Model: MT8072iP
- EasyBuilder Pro Version: V6.10.01.231
I would like to log & display hourly-interval data from a 32bit counter.
My PLC has a working register which accumulates pulses from a meter, and every (real-time) hour transfers the end-of-hour-value to a logging register which is accessible by the HMI. The working register then clears and starts counting again, and an hour later writes a new value into the logging register.
I would like to display the hourly log-data in a trend graph - which shows the hourly data points across the last 24 hours.
My idea is for the HMI to read the hourly data points just after each new hour turns, display it, then repeat an hour later.
Is this within the capability of EasyBuilderPro and my HMI? Is my approach sensible or is there a better way?
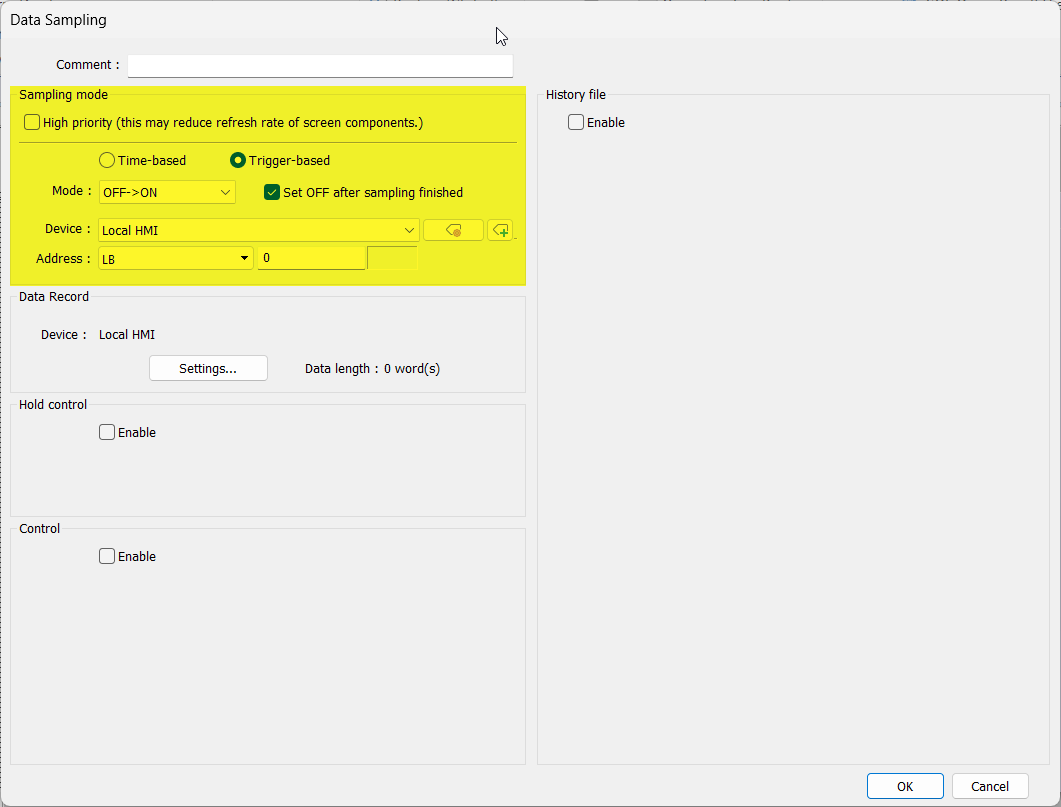
How should I synchronize data-logger sampling with the transfer of new data into the logging register? The data is stable for about one hour before a new value is written but I should avoid sampling near the hour-end. I have set 60min sample time but cannot see how to force sampling to start at a particular (real) time.
I dont understand how to produce the 24hour x-axis - please explain
Are there any tutorials that would be helpful? I have watched the Tutorial on Chapter 8 of July 2021