- HMI Model: MT8072iP
- EasyBuilder Pro Version: latest
I am just getting started with data sampling, trend displays. and history data. For my project I want to set up maybe 4 or 5 HMI screens (selectable by function keys) each showing a graph/chart of various parameters over time (eg 6 parameters on one trend graph, 4 parameters on another, etc covering a time period of (say) 3 hours with data sampled every (say) 10 sec). I will save historical data into a USB memory stick plugged in to the HMI - and removed for downloading and later analysis.
Often the parameters have different scale factors - eg temperatures have different scale from pressures. This is one reason to show different trends on different graphs
I understand that the Trend display shows a certain amount of “history”. The History data object is presented in a table (not a chart) - so there is a little overlap.
I have looked at several video tutorials but many of these demonstrate older versions of EasyBuilderPRO which have different buttons/options etc.
At the outset I am struggling to understand a few basic concepts and hope you will explain. I understand that I need to separately set up:
- Data Sampling Object
- Trend Display objects
- History Data object(s)
and while all of these objects are separate they are interlinked.
Q1 Is there just 1 data sampling object per project? OR can there be many data sampling objects - for different HMI windows? OR do I set-up a data-sample/trend-display/history-data “cluster” for each set of parameters I am interested in - which I “attach” to any particular “window” I want?
My tinkering so far suggests only 1 data sampling object per project.
Q2 if there is only 1 data sampling objects per project, then it will need to have ALL the different parameters I ever want to monitor. Then, I don’t understand how to link just a few parameters in the Data Sample Object into a particular Trend display and other parameters into another Trend display - please explain?
Q3 If there can be many data sampling objects for each project - then how do I set up a second data sampling object.
Q3 Can I combine analog and digital parameters into the same trend display - eg to track analog parameters relative to switching certain binary tags?
Thank you
Hi @BrianF_NZ ,
Thank you for your question. We can definitely clarify these questions for you.
-
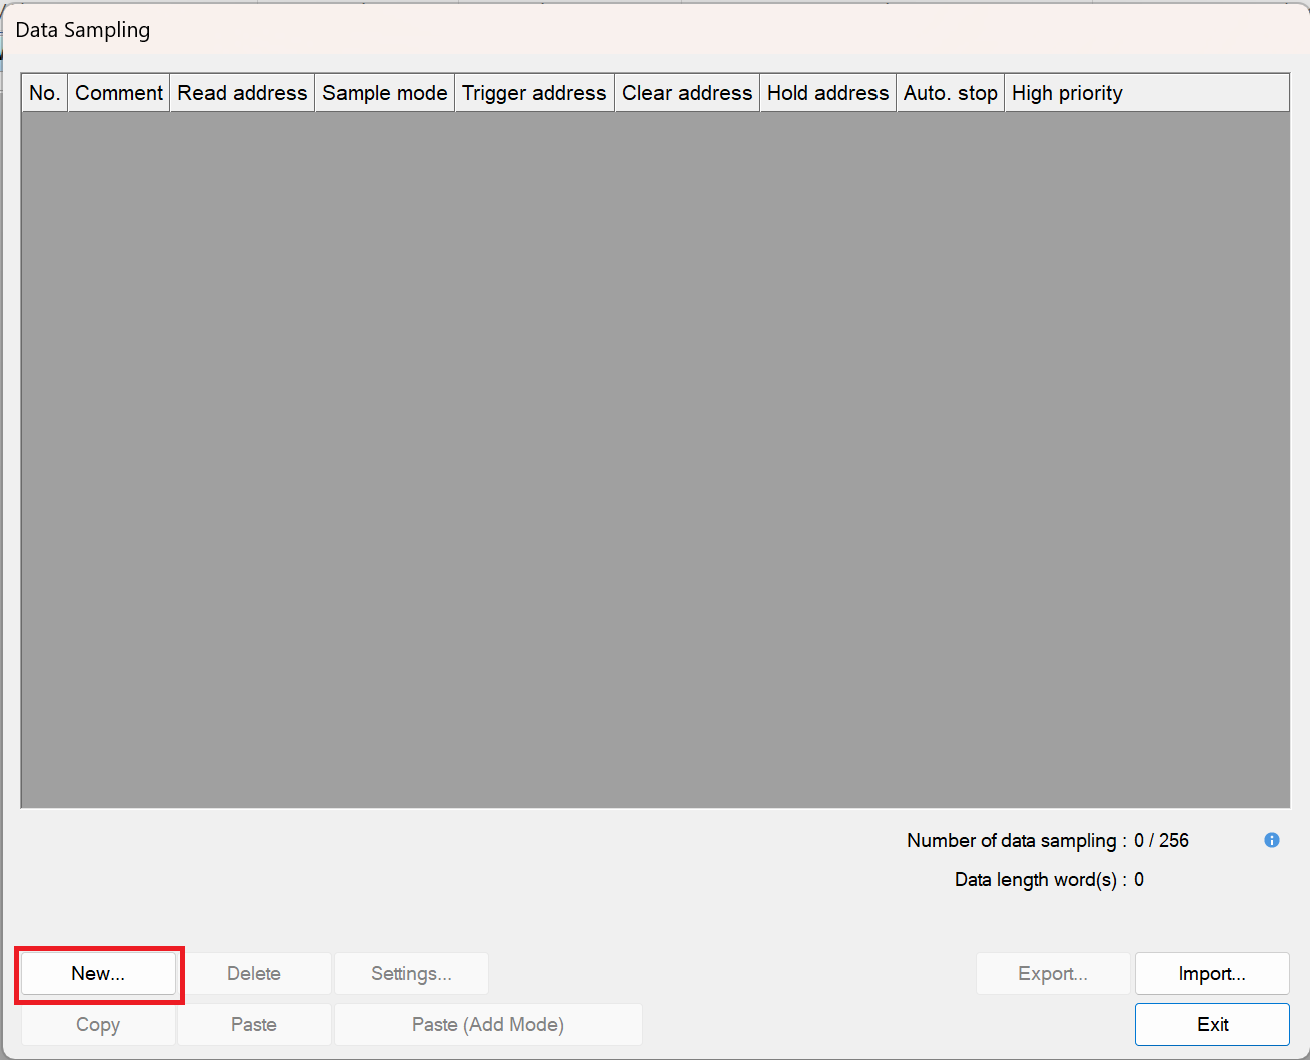
You can create multiple Data Sampling objects in one project, not just one. To create multiple Data Sampling objects, navigate to the Data/History tab > Data Sampling and create your first sampling group. Then click New and add another. Each data sampling object has its own channels, sampling interval, and storage settings.
-
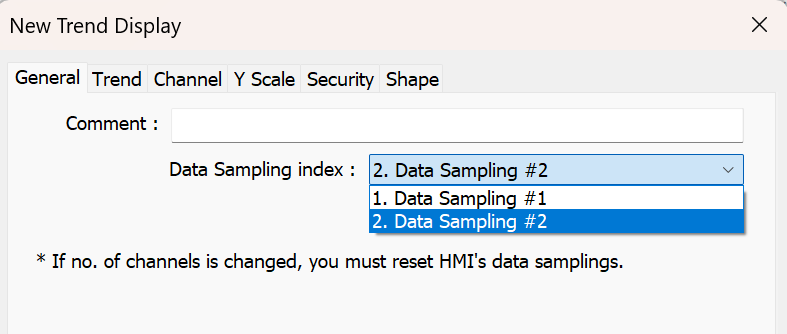
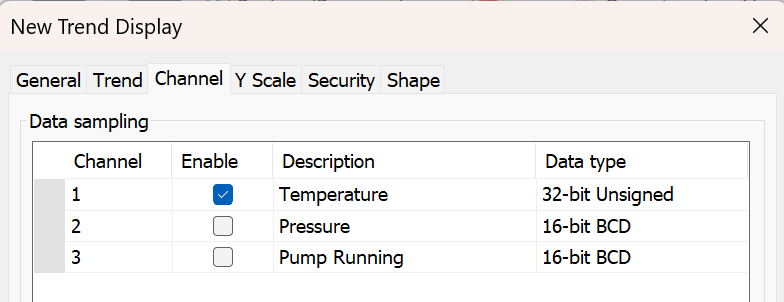
Each Trend Display is linked to a specific Data Sampling object and selected channels within that object. You can select the Data Sampling index in the Trend Display General tab, and then customize which channels to display in the Channel tab. Here is a forum post on how to customize a Trend Display object: Link.
-
Trend Display objects do not natively support boolean values directly. To display digital states on a trend, the boolean values need to be converted into integer values 0 and 1 so they can be logged properly by the Data Sampling object.
Here are some additional resources you may find helpful:
I have similar questions to before regarding setting up Event (Alarm) logs. I have a large number of alarm conditions in my project that I want to log and report via HMI.
Can I have more than 1 alarm log - do I need more than 1?
Is the alarm object attached to a particular window or is this a list “in the background” with the alarm display attached to a window??
I navigated to Data/History and selected “Event (Alarm) Log”, then “New” and added a few test alarms based on binary values in the taglist. I was initially tripped-up because the “new” alarm uses the previous one as a template - I thought I was repeating!
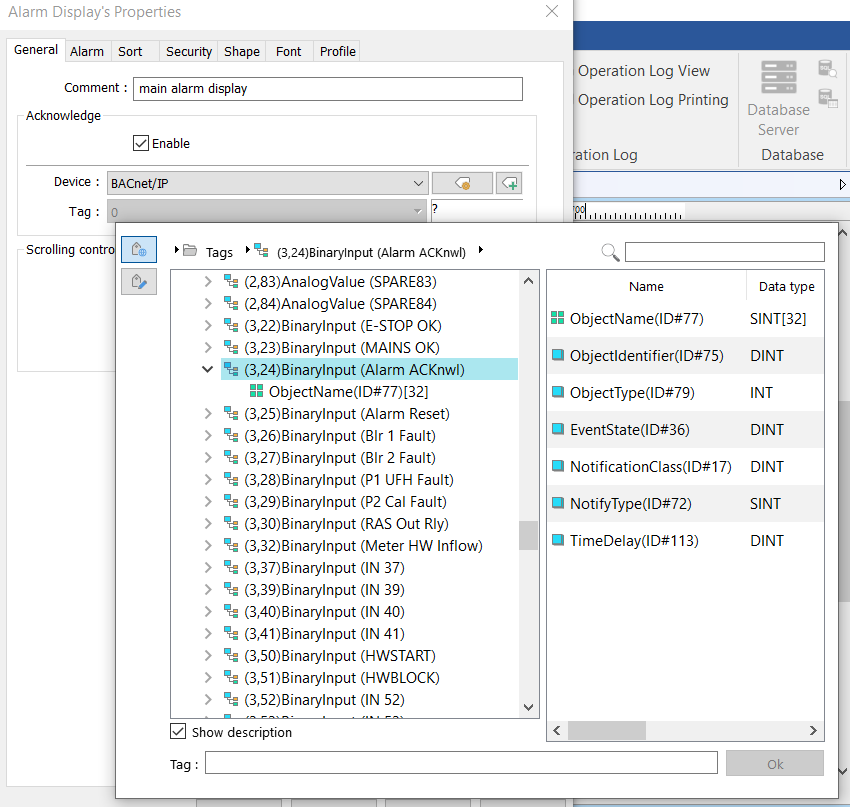
Then I tried to set up an alarm display. The first field is “acknowledge” - where I tried to reference a PLC input (Acknowledge button). Although this is a binary input (and described as such on the dropdown tag-list) the selector seems to treat this as a word not a bit - see screen shot below. This also applies to all the other binary values in the drop-down tag list. These tags should be BOOL not DINT.
How do I get EasyBuilder to recognise these tags as binary?
Back to Datalogging….
I am still struggling to understand the initial set-up for Trends - the video tutorials I have seen are helpful but only cover setting up 1 parameter on 1 display object.
So consider the following example:
Create 2 different trend displays - one called “Temperature Trend” with 3 different temperature sources (lets say Temp 1 to Temp 3 sourced from Analog Inputs 1, 2, and Analog Value 25 - ie non-contiguous), and the other display called “Pressure Trend” with 2 different pressure sources (say Press A and Press B from Analog Inputs 5, 6). All these data points are 32bit words, to plot every 5 seconds, and save data to USB1.
I have set up a data sampling object with 5 rows - 1 for each data source.
I dont understand the next steps - (a) linking the first 3 data sources to one trend display object. and (b) assigning each to a channel with its own color (lets say red, blue, green) - and then (c) linking the other 2 data sources to a different trend display object.
The trend display shows ALL the channels (data sampling index drop-down). I can only assign one channel color - not 3 different colors.
Perhaps I should have 2 different data sampling objects with 3 rows and 2 rows respectively - but I cannot understand how to do that. The only “New” button adds new rows to the one D/S object - not to start a New sampling Object/Table.
I realise this is very basic, but will appreciate your assistance.
@BrianF_NZ,
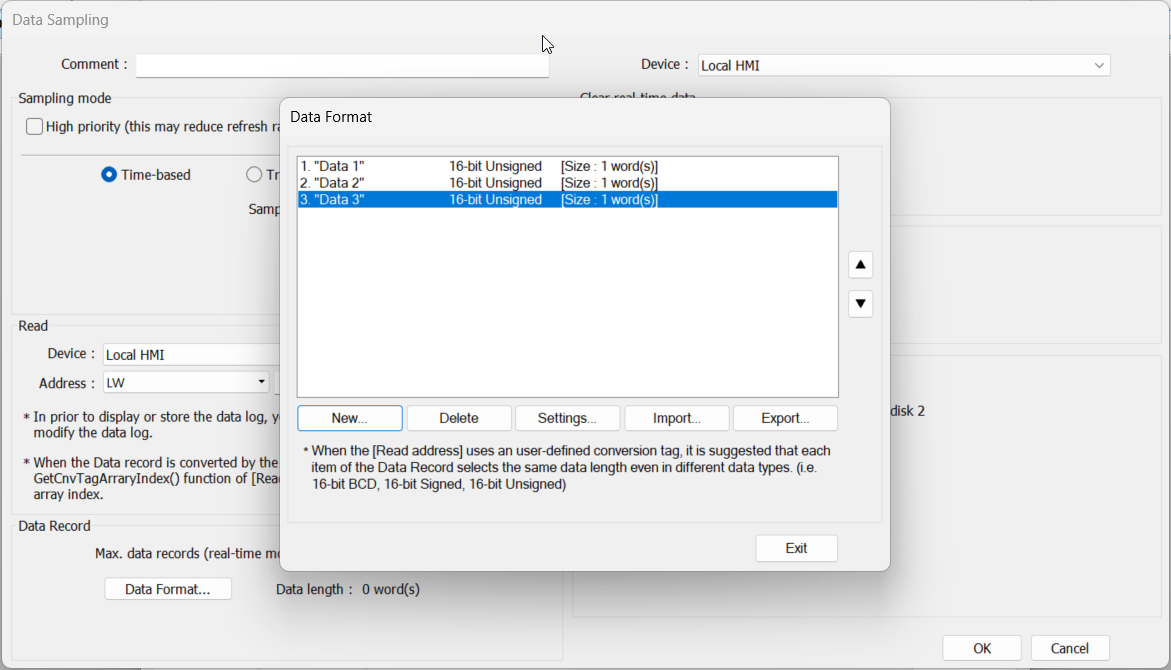
To make sure that all three data sources are linked to one trend display, please make sure that all three data points are logged within the same data sampling object. This will ensure that they are accessible or can be shown within a single trend display. As an example:
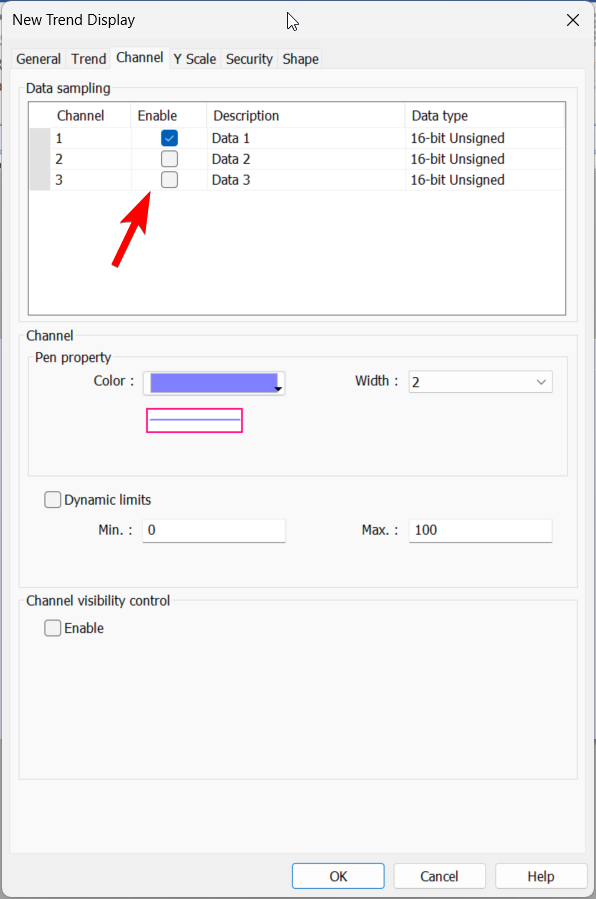
Within the “Trend Display” object enable each channel and click each one to configure the color and limit properties:
Thank you Brendon.
I was setting up the first data sampling object, but received an error message “Address [tag] is short of space/ please select an array-type tag” - so I could not finish. All my trend parameters are 32bit unsigned (DINT).
What does this message mean? How do I solve?
I also had a warning come up on the HMI - “storage space insufficient”
I have inserted a 16GB stick into USB port of my MT8072iP which I thought would be ample.
Sorry to have to ask this again: I still dont understand how to create a second data sampling object (for a new/different trend display)? Every time I click on the d/s toolbar icon I get back to my original d/s object - not a second object. I understand that each trend display object must have its own data sampling object - correct?
Hi @BrianF_NZ,
This usually indicates that you are attempting to read a larger word count that is possible from the selected variable. Can you please post an image of your configuration for our review?
Also, please note that it is not necessary to create a different data sampling object for each trend display. This is only necessary if you need to display a different trend.