Introduction:
The Trend Display object will display a trend line that reflects data recorded by a Data Sampling object. Within this post, we discuss some of the basic elements of the trend display.
Software Version:
EasyBuilder Pro 6.03.02.393+
Instruction:
-
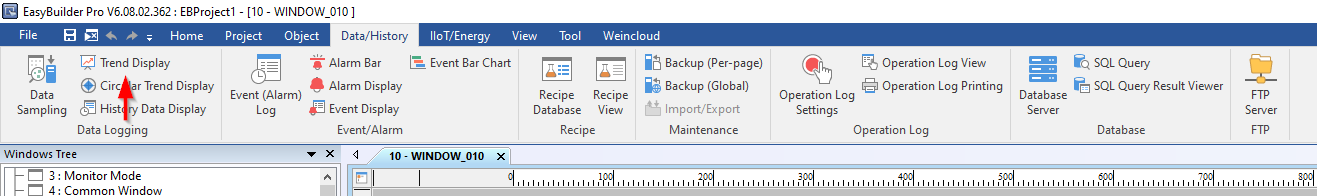
Locate the “Trend Display” object within the “Data/History” tab:
-
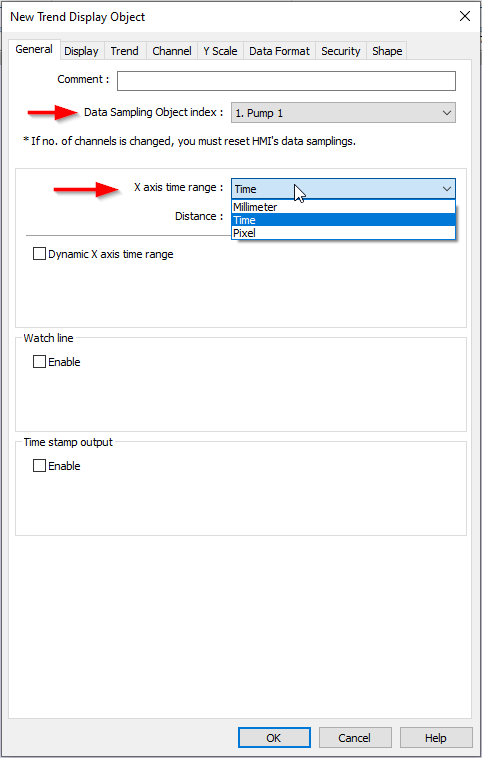
In the “General” tab of the Trend Display, make sure that the “Data Sampling Object Index” holds the correct Data Sampling object. In the drop-down menu above the “Distance” entry box, select the preferred x-axis units:
-
Within the “Trend” tab, you can modify the graph’s frame and background colors, enhance the graph’s clarity by incorporating a grid, or include time/date information. Customization options extend to the color selections for these elements:
-
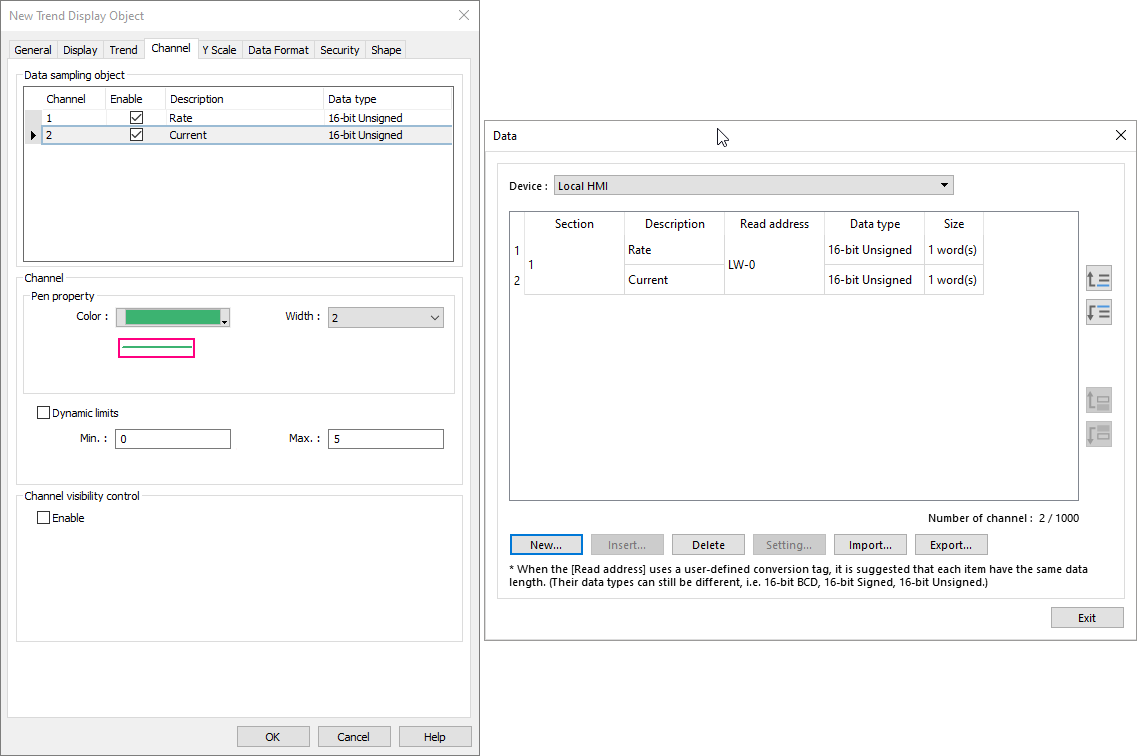
In the “Channel” tab, you can see each item configured within the “Data Format” section of the “Data Sampling” object. When you check the “enable” button, the channel will be displayed on the graph. If unchecked, it will not be displayed:
-
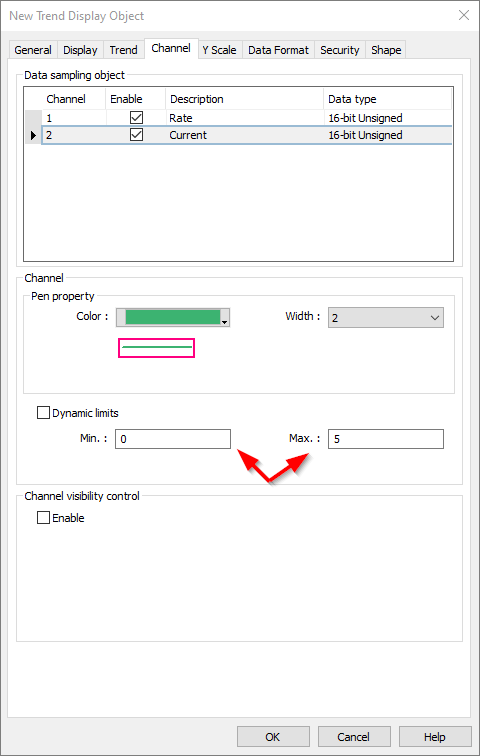
The “Min.” and “Max.” limit of each channel and the channel’s color can be customized by clicking the corresponding channel. The limits affect only the selected channel, therefore different channels can have different “Min.” and “Max.” limits:
-
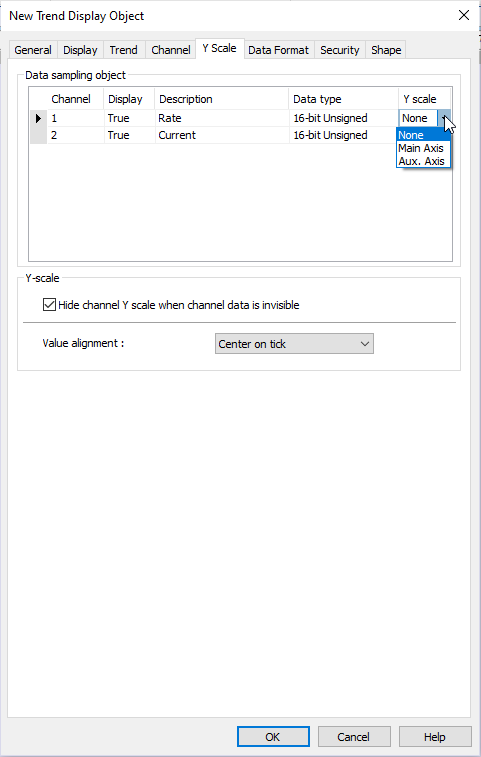
To configure a Y-Scale, click on the “Y Scale” tab and click within the “Y Scale” column of a channel. A drop-down list will appear allowing you to set the scale type to “Main” or “Auxiliary”. These settings determine the placement of the Y Scale. A channel configured with “Main Axis” will have the Y Scale closest in proximity to the display region of the graph:
Note: “Grid” must be enabled within the “Trend” tab to view this option.